Evaluation Dashboard
The holodeck test view command launches an interactive Dash-based dashboard that visualises your agent's evaluation-run history. It reads the timestamped JSON files that holodeck test writes under results/<agent-slug>/ and renders three views:
- Summary — a pass-rate time series, metric-breakdown chart, and sortable/filterable run table.
- Explorer — a three-column drilldown (runs → cases → detail) with the full per-case conversation, tool calls, expected-tools coverage, and evaluation metric rows.
- Compare — a side-by-side diff for up to three runs, driven by a floating "compare tray" that accumulates as you click.
The dashboard complements holodeck test: CI gets hard pass/fail, humans get a UI for spotting regressions and prompt-version drift.
Quick start
uv add "holodeck-ai[dashboard]"   # one-time: install the optional extra
holodeck test view                # from any directory with an agent.yaml
# → serves the dashboard at http://127.0.0.1:8501/ (Ctrl+C to stop)
No real runs yet? holodeck test view --seed renders a built-in golden fixture.
Installation
The dashboard is an optional extra — install it with:
uv add "holodeck-ai[dashboard]"
# or
pip install "holodeck-ai[dashboard]"
If the extra isn't installed, holodeck test view exits with a helpful install hint and code 2 instead of a Python traceback.
Launch
From any agent directory (containing an agent.yaml):
holodeck test view
Then open the URL it prints — http://127.0.0.1:8501/ by default.
Flags
| Flag | Default | Purpose |
|---|---|---|
agent_config (positional) |
agent.yaml |
Path to the agent config; its name is slugified to pick results/<slug>/. |
--port |
8501 |
Port the Dash server binds to. |
--host |
127.0.0.1 |
Bind host. Override with caution — see security note. |
--no-browser |
off | Don't auto-open the browser. |
--seed |
off | Render the built-in golden fixture (24 runs, 6 prompt versions) — no real results needed. |
Ctrl+C forwards cleanly to the Dash subprocess and shuts the server down.
Quick tour with the seed dataset
holodeck test view --seed
Handy for demos and UI work when you don't have any real runs yet. In this mode the dashboard ignores results/ entirely.
How it reads runs
Each invocation of holodeck test writes one file:
results/<slugify(agent.name)>/<ISO-timestamp>.json
The dashboard:
- Scans that directory for
*.jsonon startup. - Polls every 5 seconds — new run files appear without a restart. Edits to existing files (backfills, redactions) are also picked up.
- Skips corrupt or schema-violating files with a warning log, rather than crashing.
This means the loop is: leave holodeck test view running in one terminal, iterate on agent.yaml + holodeck test in another, and watch the new row appear in Summary.
Prompt versioning
The dashboard groups runs by prompt version, so you can see pass-rate impact as the system prompt evolves. Versions come from YAML frontmatter on your instructions file:
---
version: v1.2.0
author: your-name
description: Short description of what changed.
tags:
  - rag
  - legal
---

# Your system prompt body
...
Recognised keys: version, author, description, tags. Any other keys are preserved under extra on the eval-run record. If no frontmatter is present, HoloDeck derives auto-<sha256[:8]> from the prompt body so every run still has a stable identifier.
The Summary chart marks vertical boundaries wherever version changes between consecutive runs.
Conversation rendering
In Explorer, the agent reply bubble adapts to the response shape:
- Prose (default): rendered with
dcc.Markdown— headings, bold/italic, lists, tables, blockquotes, fenced code blocks. - Structured JSON: when the reply starts with
{or[and parses as JSON, it's shown as a syntax-highlighted, indented block instead.
Detection is conservative — a chatty reply that embeds JSON mid-sentence stays on the Markdown path.
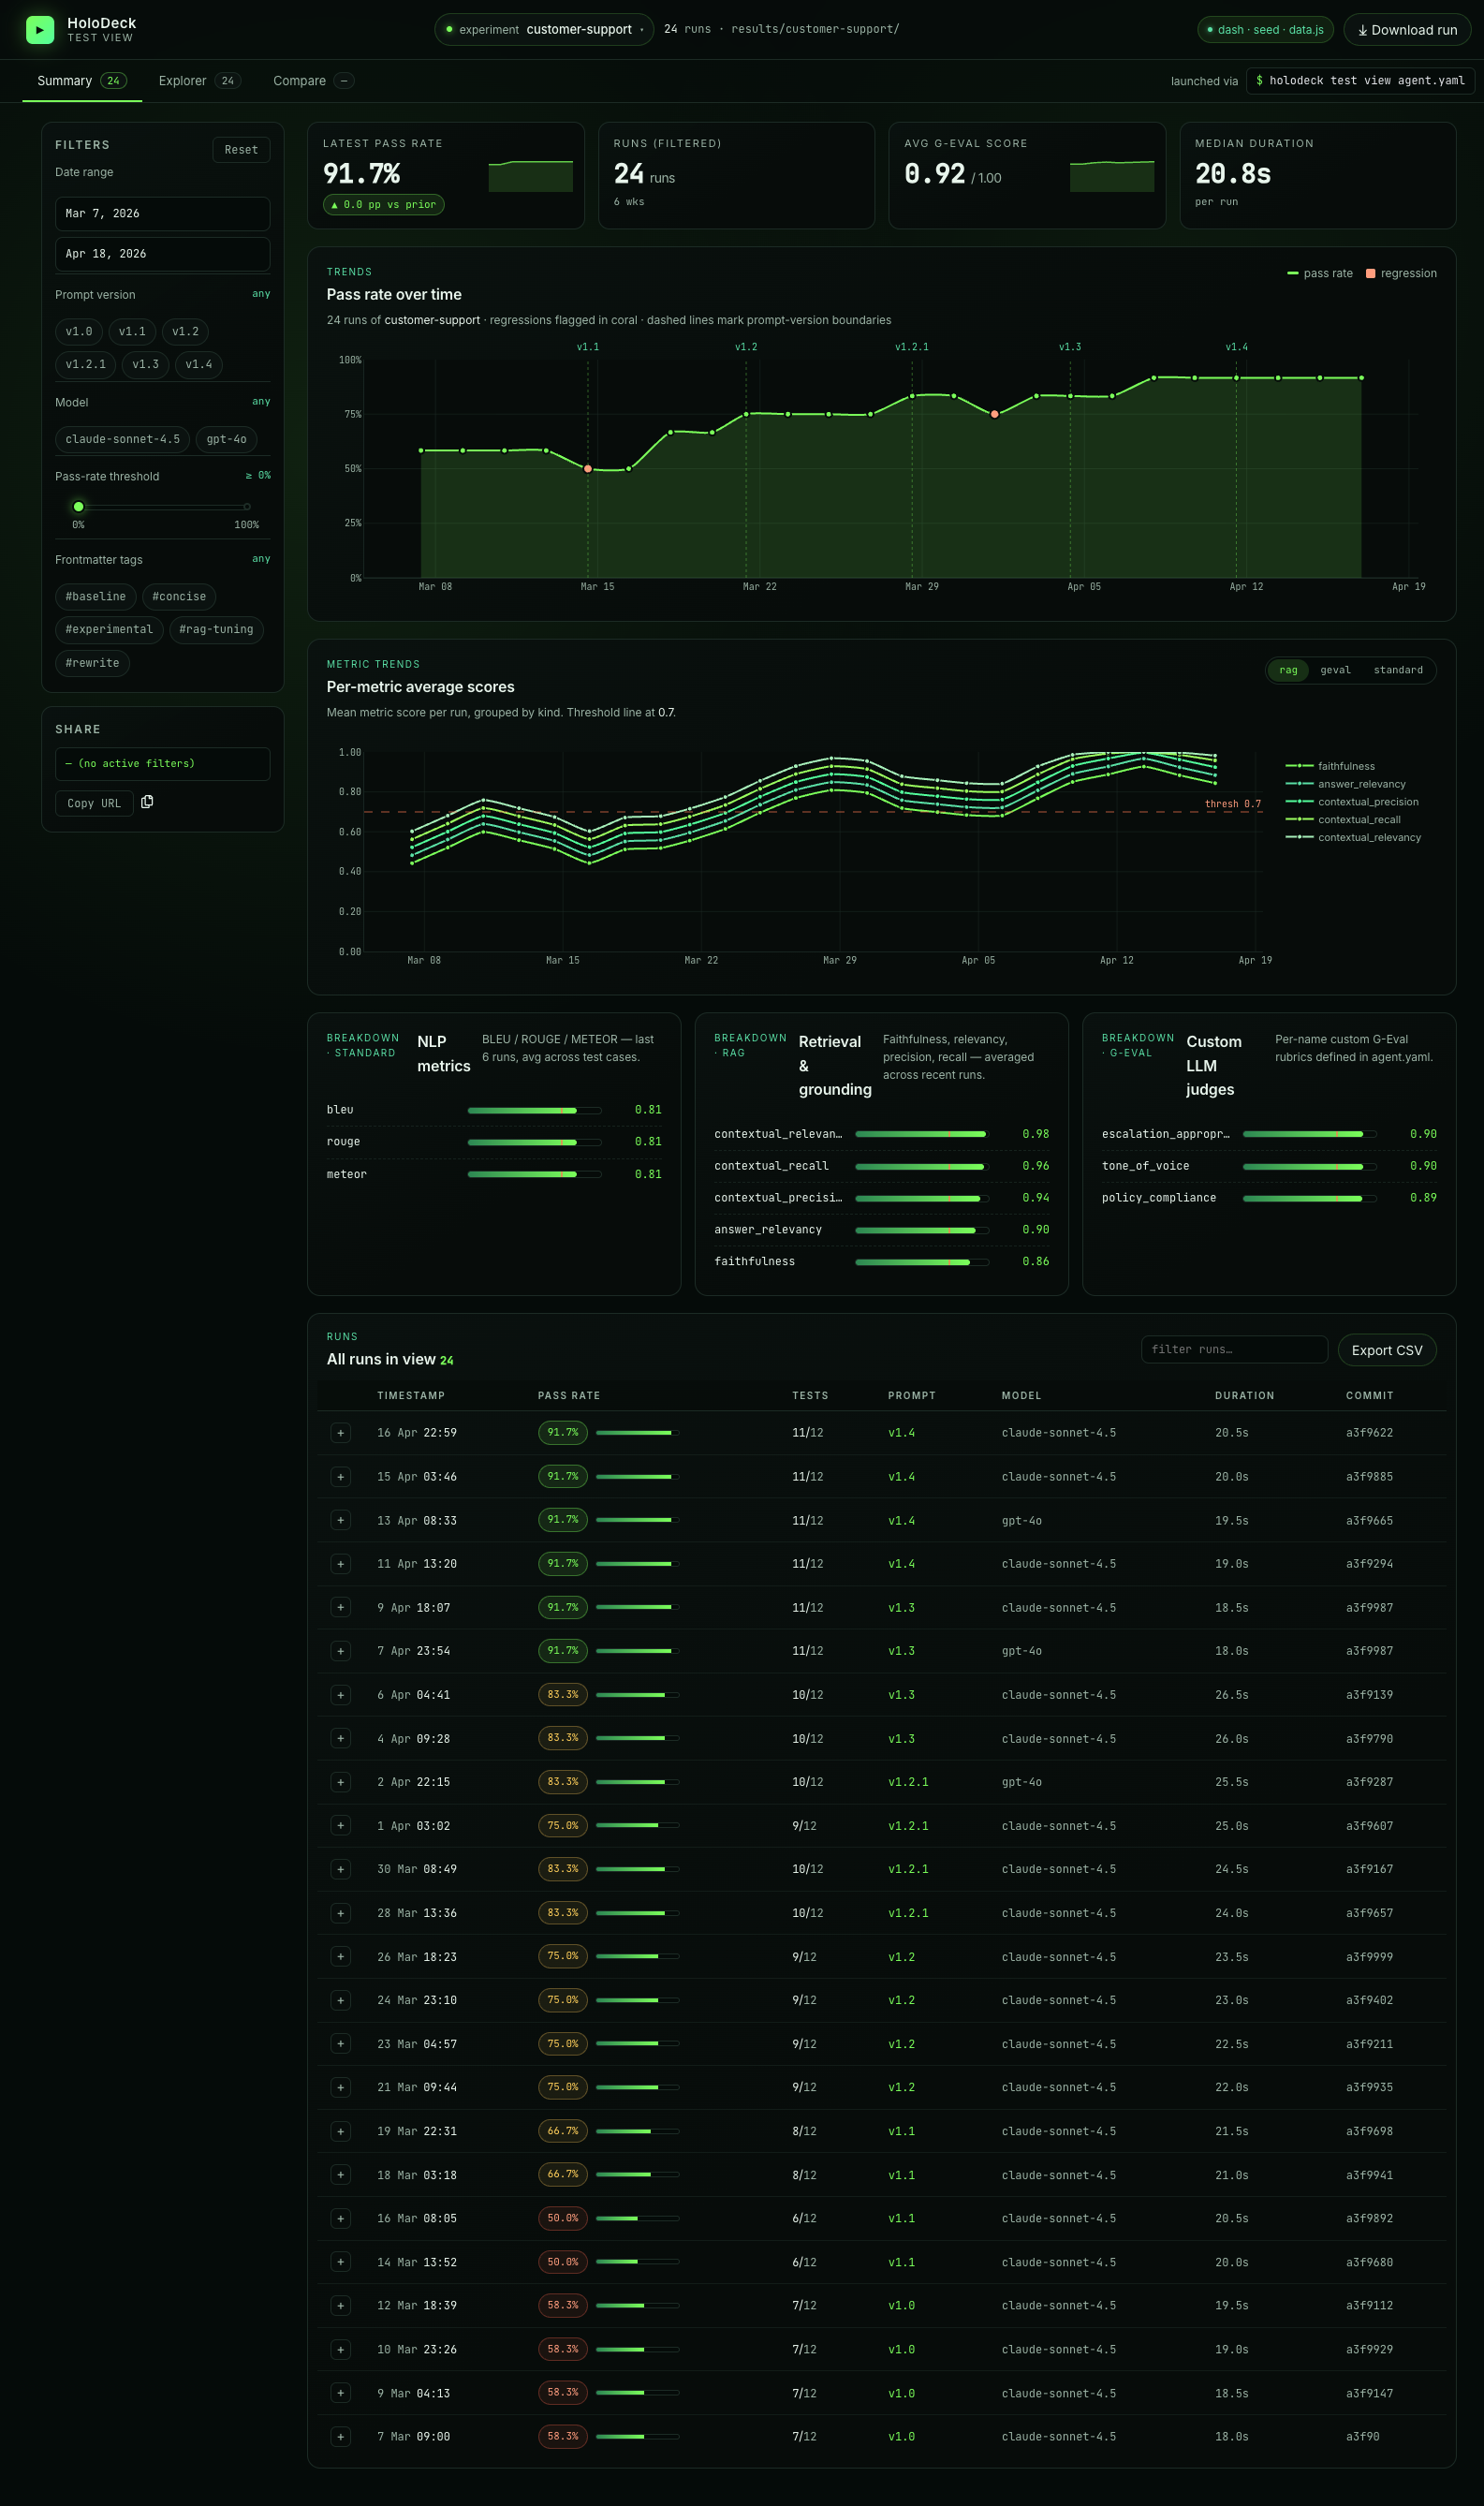
Summary view
The Summary tab is the landing page: four KPI tiles (latest pass rate, filtered-run count, avg G-Eval score, median duration), a pass-rate time series with prompt-version boundary markers, per-metric trend lines, and breakdowns for each metric kind. Scroll down for the filterable runs table — click any row to jump into Explorer on that run, or use the + button to queue a run for comparison.
Filters (left rail) narrow everything above the table in one go: date range, prompt version, model, pass-rate threshold slider, and frontmatter-tag chips.
Explorer view
Explorer is a three-column drilldown — runs on the left, cases in the middle, case detail on the right:
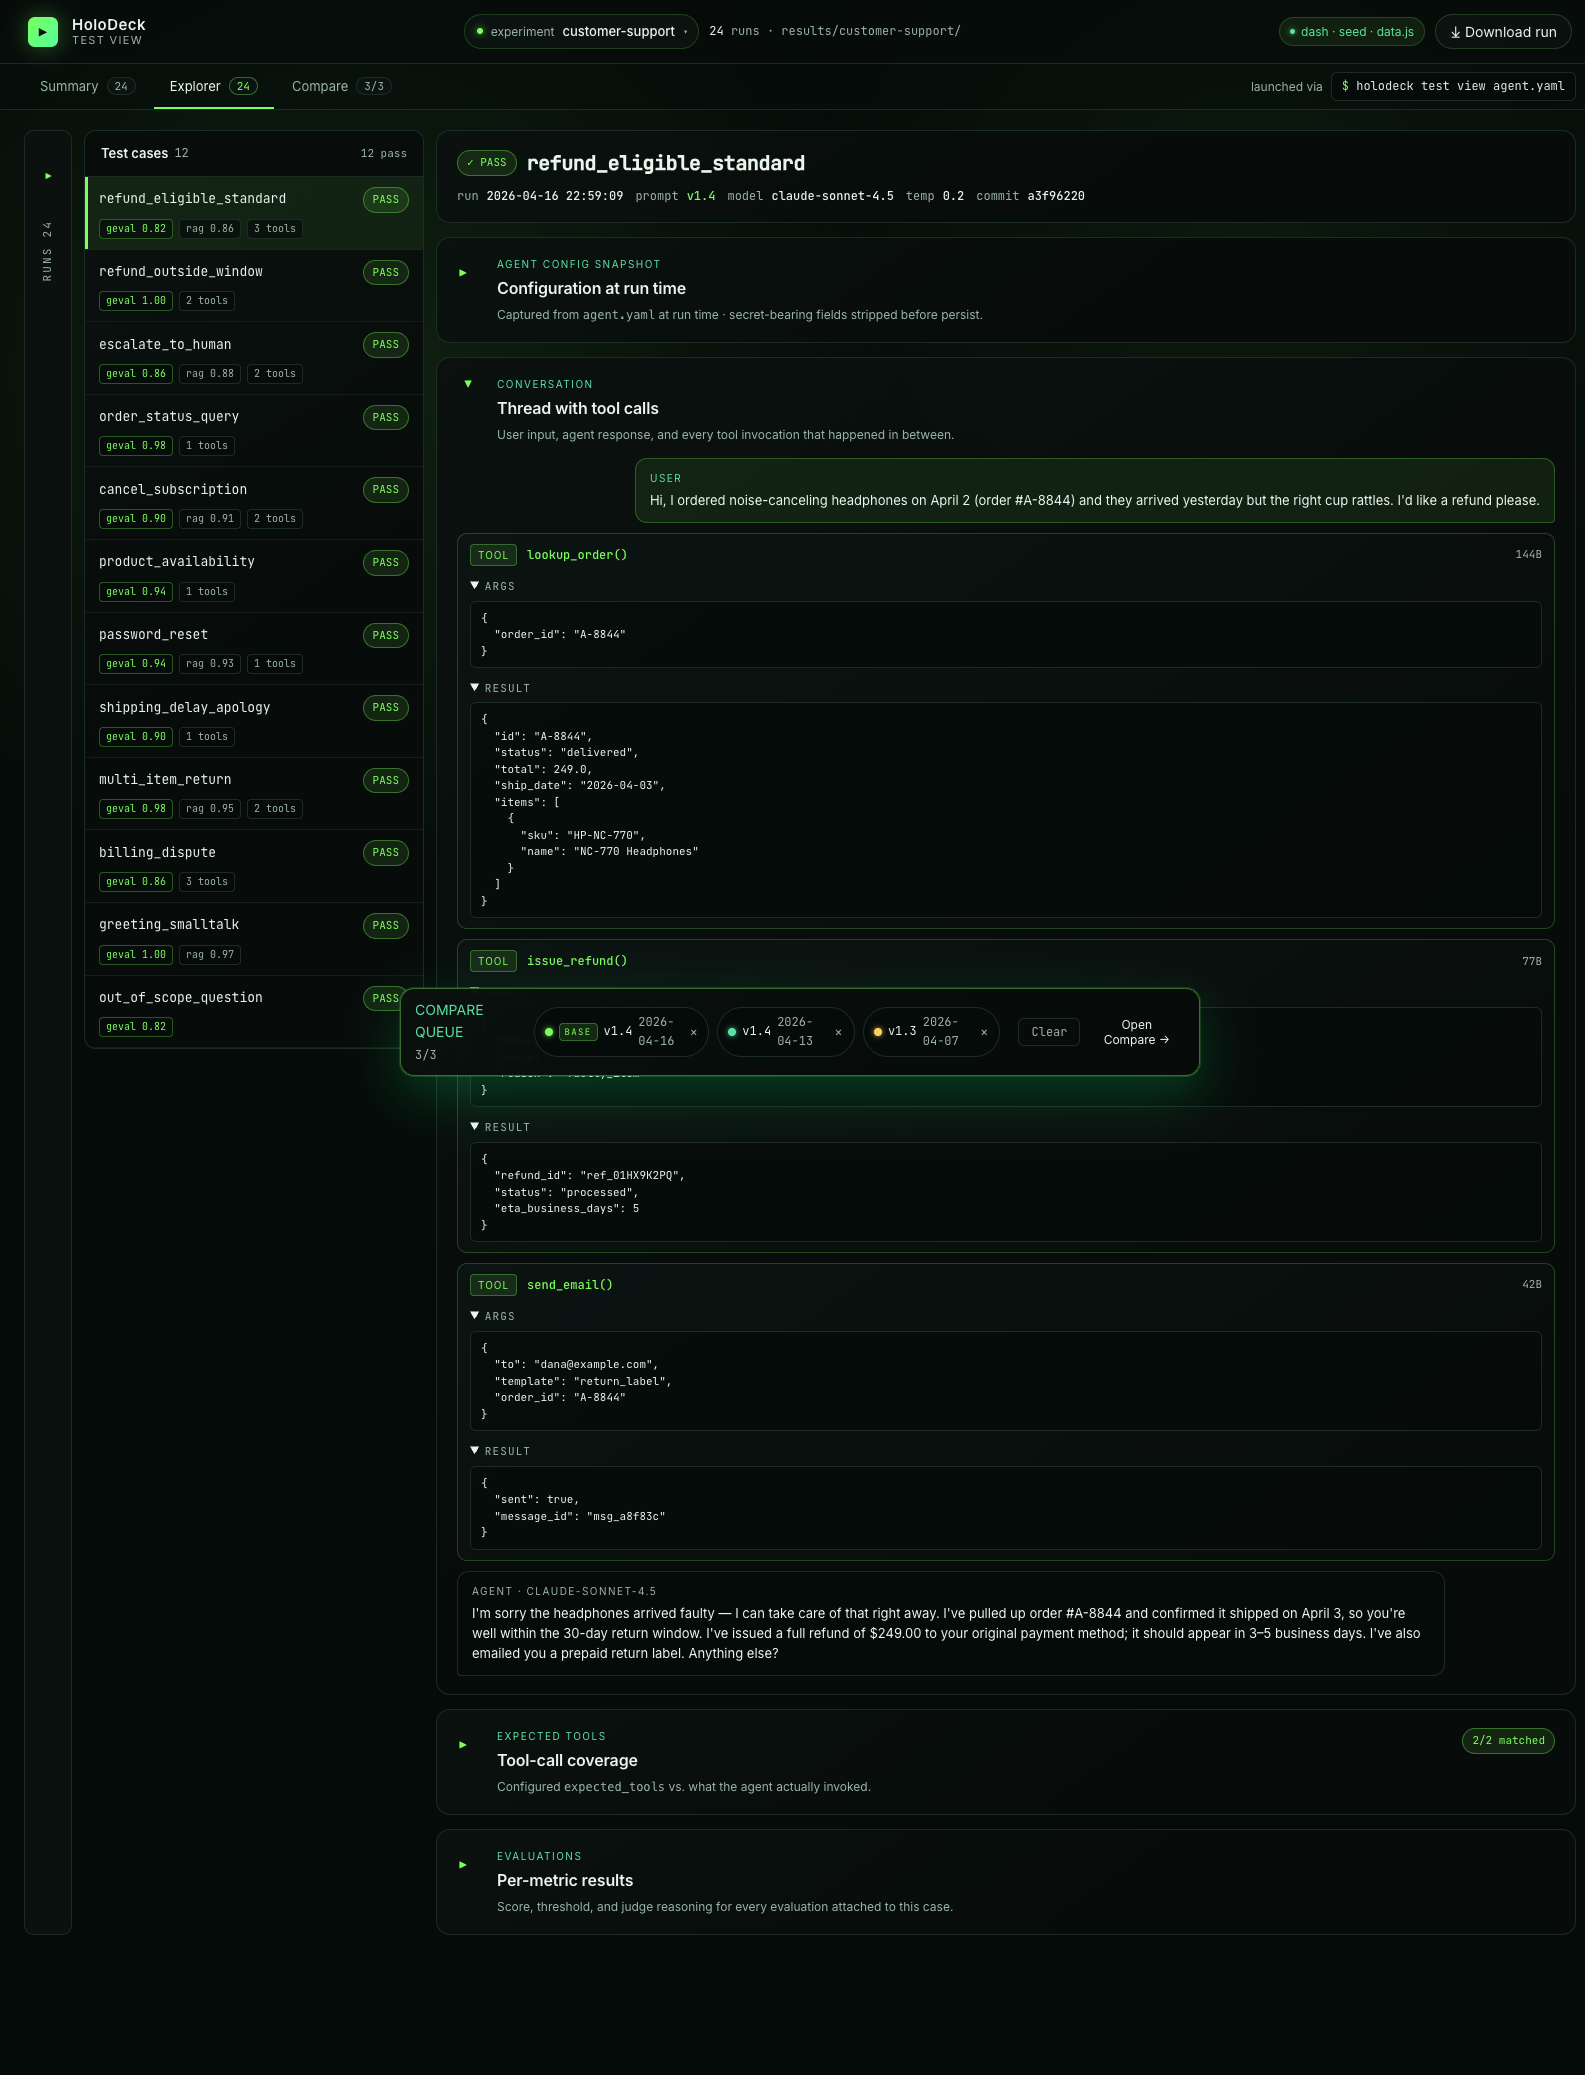
The detail panel shows the full thread (user message → tool calls with args/results → agent reply), an expandable agent-config snapshot (captured at run time with secrets stripped), the expected-tools coverage check, and every evaluation metric with its score, threshold, and judge reasoning. Large tool-call results auto-collapse.
The assistant reply itself adapts to the response shape — Markdown renders cleanly for prose, structured JSON renders as an indented code block.
Multi-turn test cases render with a turn-count chip (e.g. 4 turns · 3/4 passed) in the cases column; the right detail pane's conversation section expands each turn independently so you can inspect every per-turn input, tool invocation, metric, and error in place.
Compare view
Queue 2 or 3 runs from the compare tray (click the + button on any run row), then open Compare:
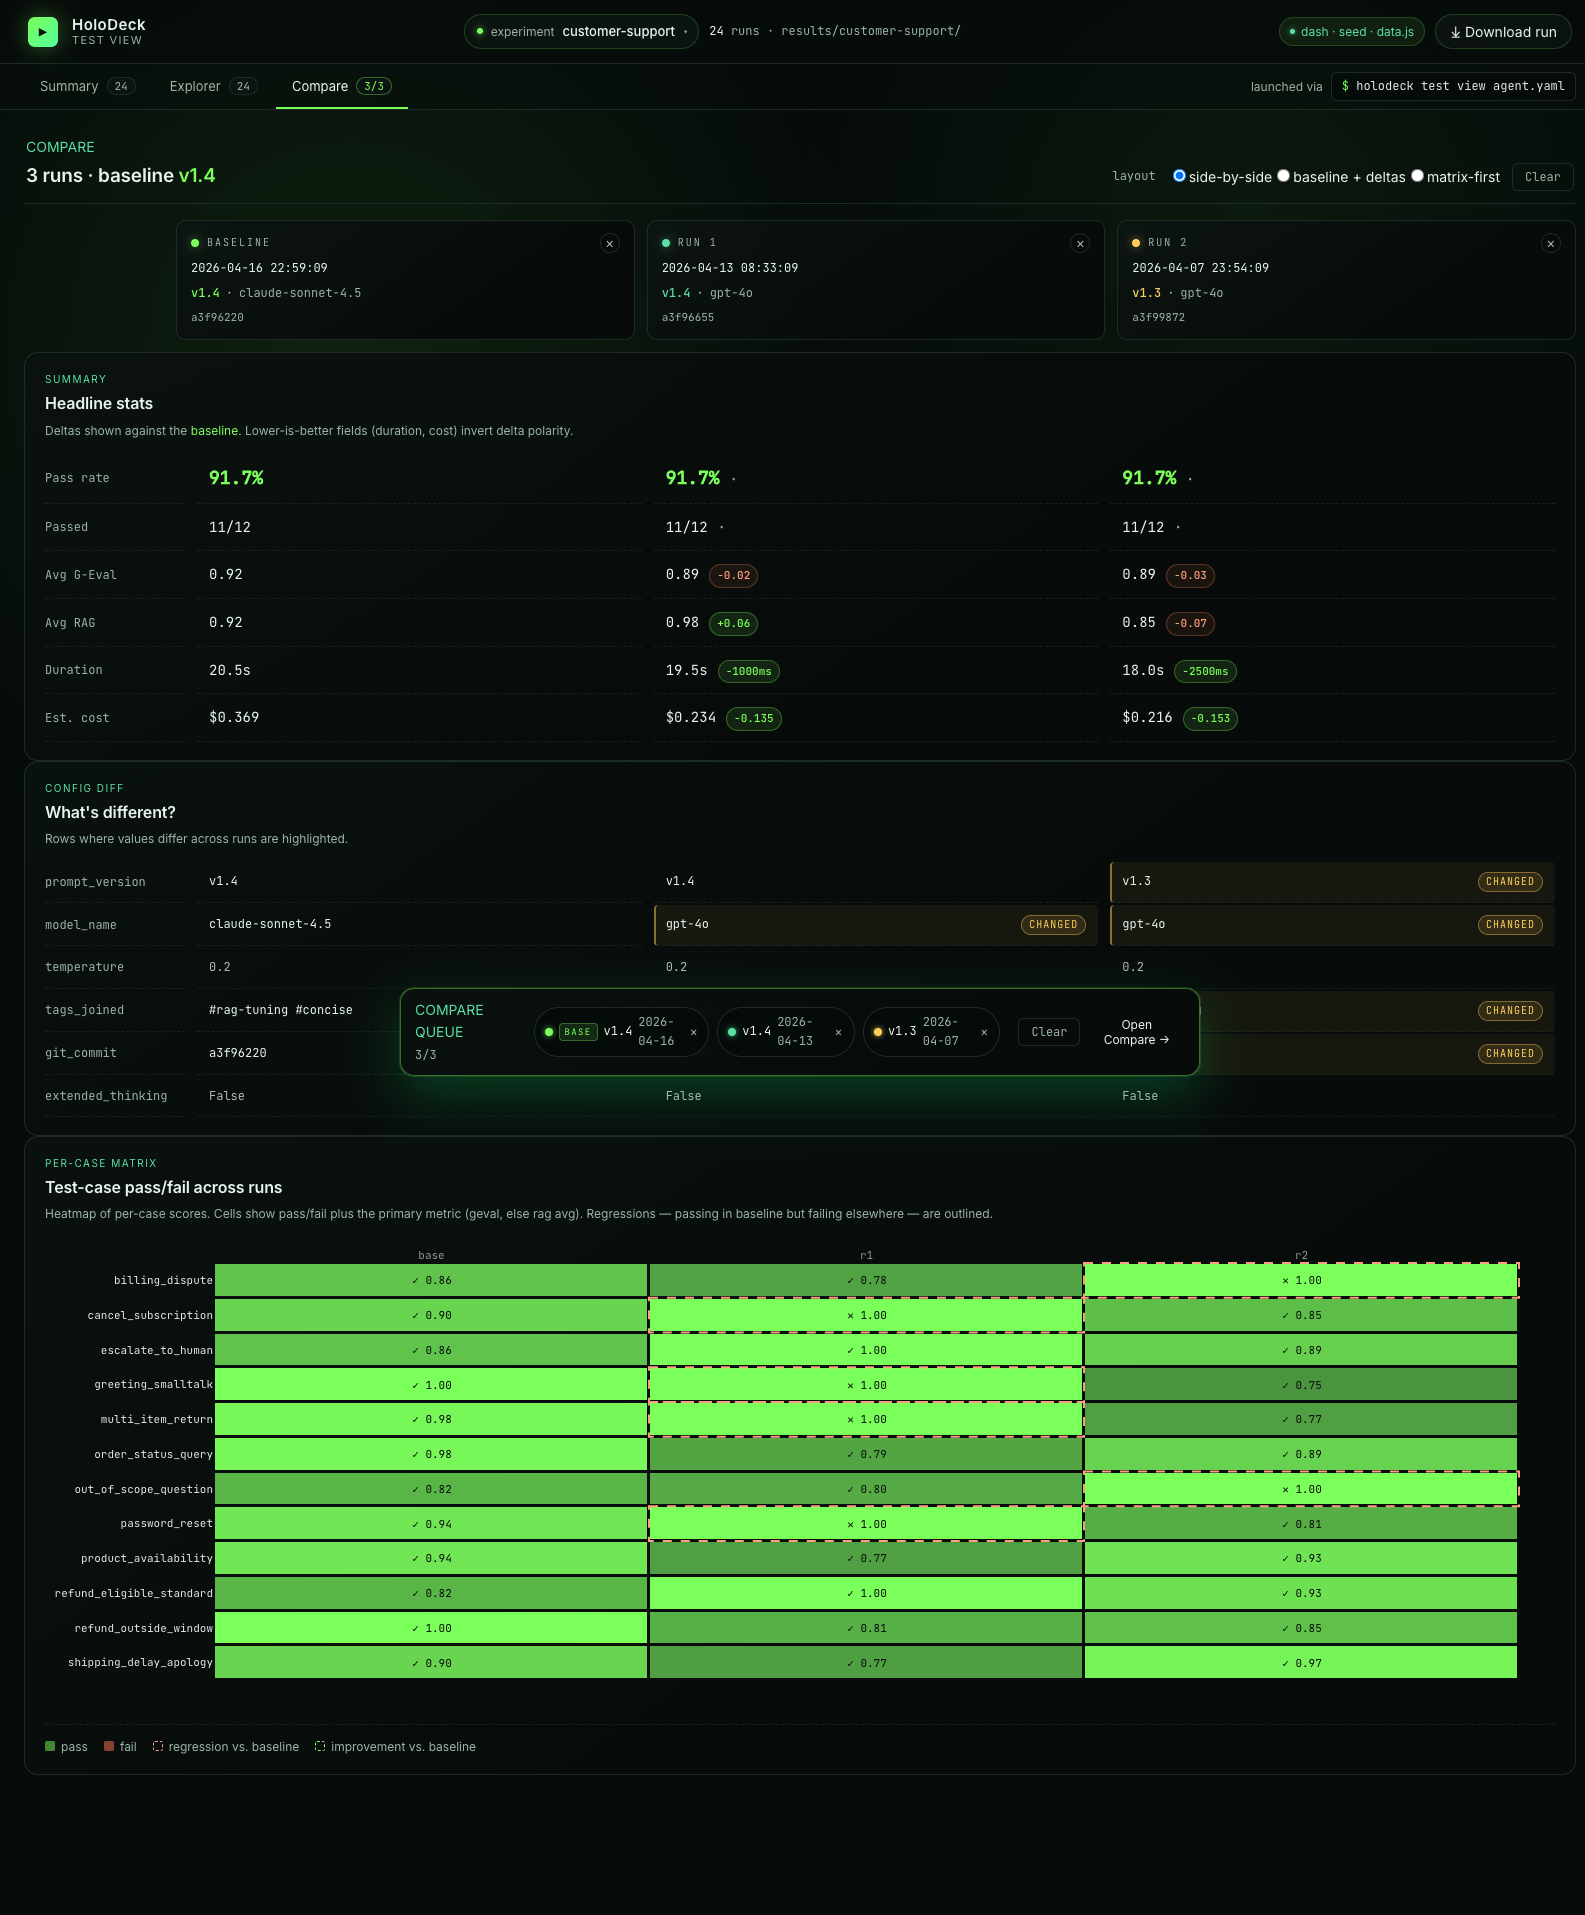
- Headline stats with deltas against the baseline (duration and cost invert polarity — lower-is-better)
- Config diff highlighting rows where prompt version / model / tags / commit differ
- Per-case matrix — a heatmap of pass/fail per case per run, with regressions (passing in baseline but failing elsewhere) outlined
Switch between side-by-side, baseline + deltas, and matrix-first layouts via the radio group at the top.
Filters and drilldown
- Summary table: filter by prompt version, model name, free-text search, minimum pass-rate slider, and metric kind (standard / rag / geval). Click a row to jump into Explorer on that run.
- Explorer runs column: collapsible, lists every run for the active agent. Pick a run, then pick a case.
- Compare tray: the floating tray at the bottom accumulates up to three runs (quick-add 2 / 3 buttons grab the most-recent runs). Click Compare to diff them across metrics, pass-rate, and the same case across runs.
Security
The dashboard binds to 127.0.0.1 by default — local-only. If you override --host 0.0.0.0 (e.g. running inside a container), the dashboard exposes your results directory on the network. Firewall the port on shared infrastructure — results JSONs may contain agent responses, tool arguments, or retrieval context you don't want to leak. A warning banner reminds you at launch time.
Troubleshooting
Dashboard says "0 runs" even though results/<slug>/ has files.
Double-check the slug. results_dir is computed from slugify(agent.name) — if you renamed the agent between runs, older files live under the old slug. Either move them to the new slug directory, or temporarily rename the agent back.
Dashboard not installed. Install the optional extra: on launch.
Run uv add "holodeck-ai[dashboard]" — the Dash/Plotly/pandas stack isn't in the base install on purpose to keep CI-only agent deployments lean.
Port already in use.
Pass --port <free-port>. The subprocess surfaces bind errors directly from Dash.